This article describes a simple investment strategy designed for people who do not have much experience in investments, but would like to optimize their gain to risk ratio and prevent high loses during any potential global crisis (2012).
Introduction
The purpose of this article is to create a simple but effective investment strategy using tools like diversification and heading. The strategy is supposed to be used by inexperienced investors with limited knowledge about financial markets. The profile of an investor is a n average risk taker . Part of the money should be invested in stocks, the other part in bonds.
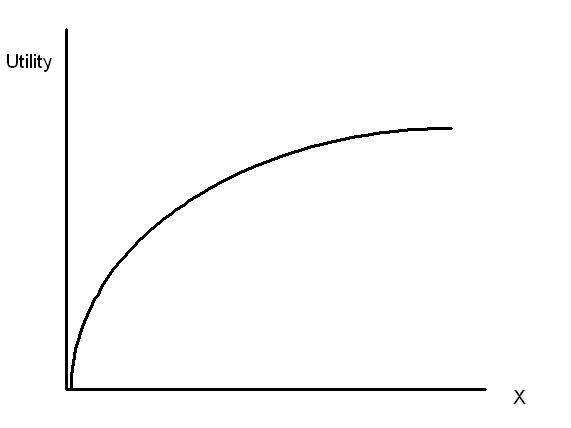
The currency used to evaluate the strategy will be Polish zloty. One of the features of human economic behavior is that the person’s utility function tends not to be linear. Because of its shape a loss of 70% is perceived in a different way than an equal gain. A big loss is felt stronger than a big gain. Good strategy should rather maximize utility than gain and therefore this work will concentrate on preventing the investors nightmare – a global crisis causing multiple assets to lose their value. The strategy will be tested with economic data from the last 5 years. In this period there were two economic crises occurring one after another.
Should we trust specialists?
We will start to create the strategy by asking a very simple question: shouldn’t we pass our money to some specialist in finances instead of investing it ourselves? At first it seems to be a crazy idea to try to compete on the market with banks and funds that spend billions dollars a year on market analysis.Isn’t it better to actually trust some fund and leave the main decisions to them? Our intuition tells us that it should be a better idea than using our own limited skills to find and buy good stocks. However the practice shows something very different. Stockwatch.pl portal has analyzed all stock funds and has found that majority of them (more than70%) had worse results than the WIG index. Also, the risk analysis showed that the Sharp factor calculated for all funds was usually below what the marked had to offer.
| Stock fund | Sharp factor | Average gain per year in % |
|---|---|---|
|
Arka BZWK Akcji
|
0,20 | 11,49 |
|
Legg Mason Akcji
|
0,20 | 11,14 |
| UniKorona Akcje | 0,17 | 10,84 |
| Skarbiec Akcja | 0,14 | 10,09 |
| BPH Akcji | 0,11 | 9,48 |
| ING Akcji | 0,02 | 7,72 |
| PZU Akcji Krakowiak | 0,00 | 7,42 |
| Novo Akcji |
-0,02
|
6,90 |
| PKO Akcji |
-0,11
|
5,24 |
|
DWS Akcji D.S
|
-0,11
|
5,11 |
| Pioneer Akcji Polskich |
-0,10
|
5,09 |
| Average | 0,05 | 8,23 |
| WIG index | 0,13 | 10,36 |
Selected Polish stock funds, data from the last 10 years.
These counter-intuitive results can be explained with the use of the efficient market hypothesis. There are many different stocks available for buying on the market. Some of them are better than others, but because of many players trying to find a good opportunity to buy a cheap stock, the real difference in attractiveness between best and worse is not significant. Even good professionals, who try to find best stocks, cannot have very high gains compared to the market. At the same time each stock fund has many internal costs; it needs to pay for marketing, buildings used by employees and for their work. The fund pays for it with the money from margins. An average margin in Poland is around 4% a year and is twice as high as in USA. It comes out that the average gain from help of a specialist is lower than the cost of this help. A very similar phenomenon has been observed in USA and has given rise to index funds. A better strategy than investment in a stock fund is direct investment in the market. You simply should buy stock by yourself even if this means choosing random companies.
Direct investment provides a very good expected gain. Unfortunately buying a single stock provides a very high standard deviation that results in a high risk (very low value of Sharp factor). To eliminate a risk specific to a single company it is necessary to buy a large number of different stocks. It is estimated that an effective diversification requires buying around 30 – 40 different stocks. It is also worth mentioning that a good diversification requires analysis of interdependencies between stocks. For example Lotos and Orlen companies depend mainly on the price of oil; prices of these companies are strongly correlated. The best solution is to create a portfolio of companies that workin different areas of economy.
How to prevent loses during a global crisis?
The nightmare of an investor is a global crisis that can cause 50-80% loss in a short period of time. Recently there have been two such crises: the first was related to the bankruptcy of Lehman Brothers Bank in the year 2008, the second to the financial problems of Greece around 2011. Unfortunately WIG index tends to drop dramatically during such periods resulting in high volatility of stocks and high loses. A way to prevent such loses is to use a heading strategy. Invest part of the money in Polish stocks and a part in an asset that is negatively correlated with WIG index. There are many assets behaving in this way. A classic example is gold, because its price always grows during a crisis. But – since the strategy assumes partial investment in
bonds – the best assets meeting our criteria are the government bonds of countries that have a strong currency.
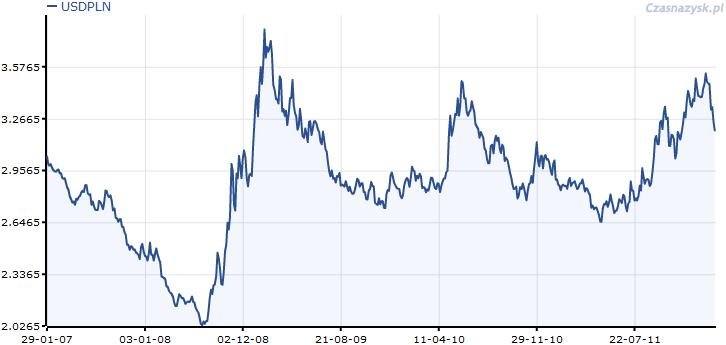
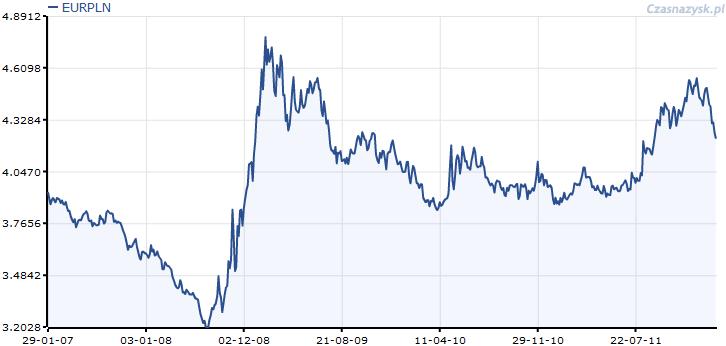
From Polish investor’s perspective the best currencies for investments are US dollar, euro, Swiss franc and pound sterling. Dollar and euro are the main two foreign currencies used in trading and franc and pound are local currencies (so any local crisis influencing WIG index should also influence currency exchange rate). For the sake of simplicity this document will concentrate on dollar and euro.
The following charts show that there is at least some correlation between WIG index and currency exchange ratio.

Building the strategy
We already know the skeleton of the strategy. It is based on investment in stocks of many random Polish companies and hedged with investment in foreign government bonds (US dollar and euro). What we do not know are the proportions of different types of investment. How much should we invest in US or European bonds and how much in Polish stock? The answer can be based only on past behavior of currency exchange and WIG index. By analyzing data from the last 5 years we can calculate the proportions that should reduce the risk. Since the main purpose of the strategy is the reduction of risk during crises, annual standard deviation of gain was used as a metric of risk for different combinations of proportions. Calculations are attached to this document in a form of a spreadsheet.
Assumptions of the calculations:
- Value of the portion of money invested in Polish stocks changes in the same way as WIG index.
- Value of the portion of money invested in foreign government bonds changes because of changing exchange rate and because of bond interest rates – 3% (US bonds) or 4% (average European country).
- The metric of the strategy is standard deviation of the portfolio.
- The lower the standard deviation, the safer the investment is.
- High gain is not expected during a crisis.
- The cost of exchanging money is negligible.
- The values of WIG index and exchange rates were checked once a month (calculations could be improved by checking values once a day or even every day , but for the sake of simplicity one month is assumed).
- No debt (leverage) is allowed.
It is possible to find the proportions via numeric analysis. Because no popular application allows changing two variables at the same time, the solution can be found manually by modifying percentage of investment in euro until the smallest standard deviation is found. Later the percentage of investment in dollars should be changed in a similar way to find the minimal standard deviation. By repeating this process until any change in proportion results in a higher metric it is possible to find the optimal solution.
Final strategy
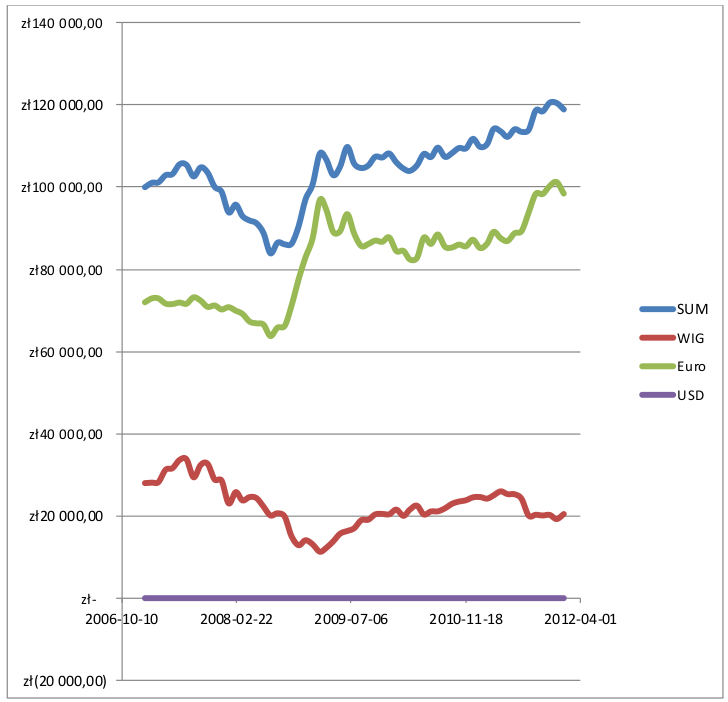
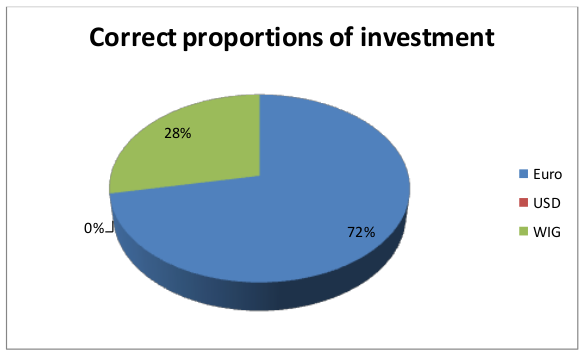
Simulation has shown that the best proportions of investment are 28% (Polish stocks), 72% (European bonds) and 0% (American bonds). The last value is very interesting. Values below 0% were not checked because of the strategy assumptions (lack of debt), but probably from an investor’s perspective it could be profitable to have a debt in dollars and invest more money in euro and Polish stock. Unfortunately these proportions are based on past data and there is no guarantee that they will be best during next crises.
It seems that Euro is a better currency for hedging than the US dollar. During the crisis investment had an attractive gain – 3,53% a year. Compared with 4% interest rate in euro and with an assumption that this gain was measured during two crises this value is really good. At the same time, the investment had also quite an attractive standard deviation – only 8,99% in the worst. The value is small compared to the changes in WIG index that lost at some point 67% of its value. What is also interesting is the expected gain outside of the period of crisis. Assuming than the exchange rates won’t change, it should be calculated in the following way:
EG = 28% * 10,36% + 0% * 3% + 72% * 4%= 5,79%
The last chart shows how three types of investment combined together eliminate some portion of the volatility.